Description
Data collection
Dream Report software includes a Eurotherm Review driver and report templates that provide access to historical data from devices such as 6000 series graphic recorders, T2550 programmable automation controllers and Eycon TM Visual Supervisor. The data can be collected either automatically over an Ethernet network or manually using removable media.
A robust communications system core is in place that enables the collection of data and alarms from multiple real-time and historical sources. This is done using the OPC, OLE and ODBC standards to ensure a common interface for sources from different manufacturers.
Reporting
In automatic mode, the generation of a report can be triggered by an event or by pre-planning. In manual mode, an additional application (Dynamic Report Generator TM – DRG) provides the ability to change report schedules or generate an on-demand report at any time.
Data recording
The Dream Report software with its powerful historian records by groups, dates and alarms:
- of OPC servers
- from other connected real-time sources – ODBC, OLE etc.
- of computational data defined in reports
With unlimited groups set up with their own recording settings, error-free and accurate values can be obtained and recorded via the SQL Server’s MSDE by default. Other open databases such as Oracle, MySql, Access or the Eurotherm Information Manager can also be used.
Purpose
- Text display: Enables the extraction and display evaluation from historical databases such as the review database.
- Tables: Multiple options for getting data and alarms into different tables. The user can choose pre-formatted tables or create their own using the SQL table.
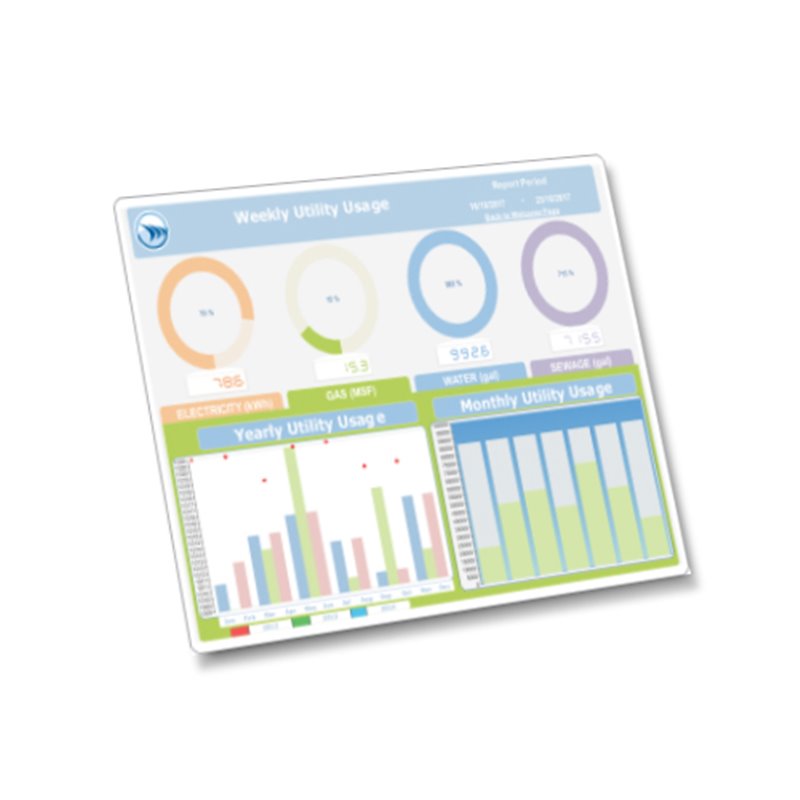
- Bar and Pie Charts: Bar and pie charts to illustrate various statistical values and alarms with advanced visualization views (%, legend, values, etc.).
- Charts: The user can define time-dependent XY charts. Charts from different time windows can be combined for visualization in order to quickly compare results. In addition, the Chart object supports different types of data (values, averages, linear regression). Multiple scales can be displayed and changed automatically or manually.
USER-FRIENDLY EQUIPMENT FOR:
- Data collection
- Data acquisition and evaluation
- Report design
- Reporting
- Report distribution